Charts / Trends#
Charts enable you to study your sleep from a long-term perspective.
Charts help you identify patterns in your sleep, allowing you to make evidence-based changes to your routine for better rest.
Menu Path: Left ☰ Menu → Charts
- Date Range: Controlled by the first dropdown menu in the top bar. Charts are computed using data from the selected window.
- Tags: Filter any chart by selecting a specific sleep tag from the second dropdown menu in the top bar.
Trend#
Sleep Score#

The Sleep Score radar chart provides a multi-dimensional view of your Sleep Score. Each section represents a different health metric and can earn up to 5 points. The goal is to fill the entire chart!
Deficit#

The Deficit chart tracks your accumulated sleep debt.
- Negative Values: Occur on days when you sleep less than your Daily Sleep Duration Goal.
- Positive Values: Indicate a sleep surplus.
- The Red/Green Indicator: The rightmost point of the line indicates your current state. Red means you have a sleep debt; green means you are currently meeting or exceeding your target.
Duration#

The Duration chart tracks how your sleep length evolves over time.
- Actual Duration: Shown for ranges of a quarter-year or less.
- 30-Day Average: Shown for half-year ranges or higher. Each point represents the average duration of that day and the 29 preceding days.
Example: The point at May 30th is the average of sleep durations from May 1st through May 30th.
Regularity#

The Regularity chart measures consistency. A higher line indicates more irregular sleep patterns. You should strive to keep this line as low and flat as possible.
Regularity Index (SRI) #

This chart displays your Sleep Regularity Index. An SRI of 100% means your sleep/wake times were identical between consecutive days. Values above 80% are considered healthy. Read more on SRI here.
Regularity Index (+/-) #

Shows the fluctuation of your SRI compared to your long-term average.
- Blue Columns: Increase in regularity.
- Red Columns: Decrease in regularity.
Deep Sleep %#

Tracks the percentage of your total sleep duration spent in deep sleep. This is a primary indicator of sleep quality. Ideally, your average should stay above 30%.
Deep Sleep (Duration)#

Tracks the actual number of hours spent in deep sleep. Ideally, this should be a flat line above 2 hours.
Awake#

Tracks total awake time detected during tracking sessions. In an ideal record, this is a flat line at the bottom of the chart.
Efficiency#

The ratio of actual sleep time to total time spent in bed. For example, if you are in bed for 8 hours but are awake for 2, your efficiency is 75%. Strive for values close to 100%.
Snoring %#

The ratio of sleep duration spent snoring. Ideally, this should be a flat line close to 0%.
Snoring (Duration)#

The total detected duration of snoring per night. Ideally close to 0 minutes.
Graphs (Sleep Bars)#
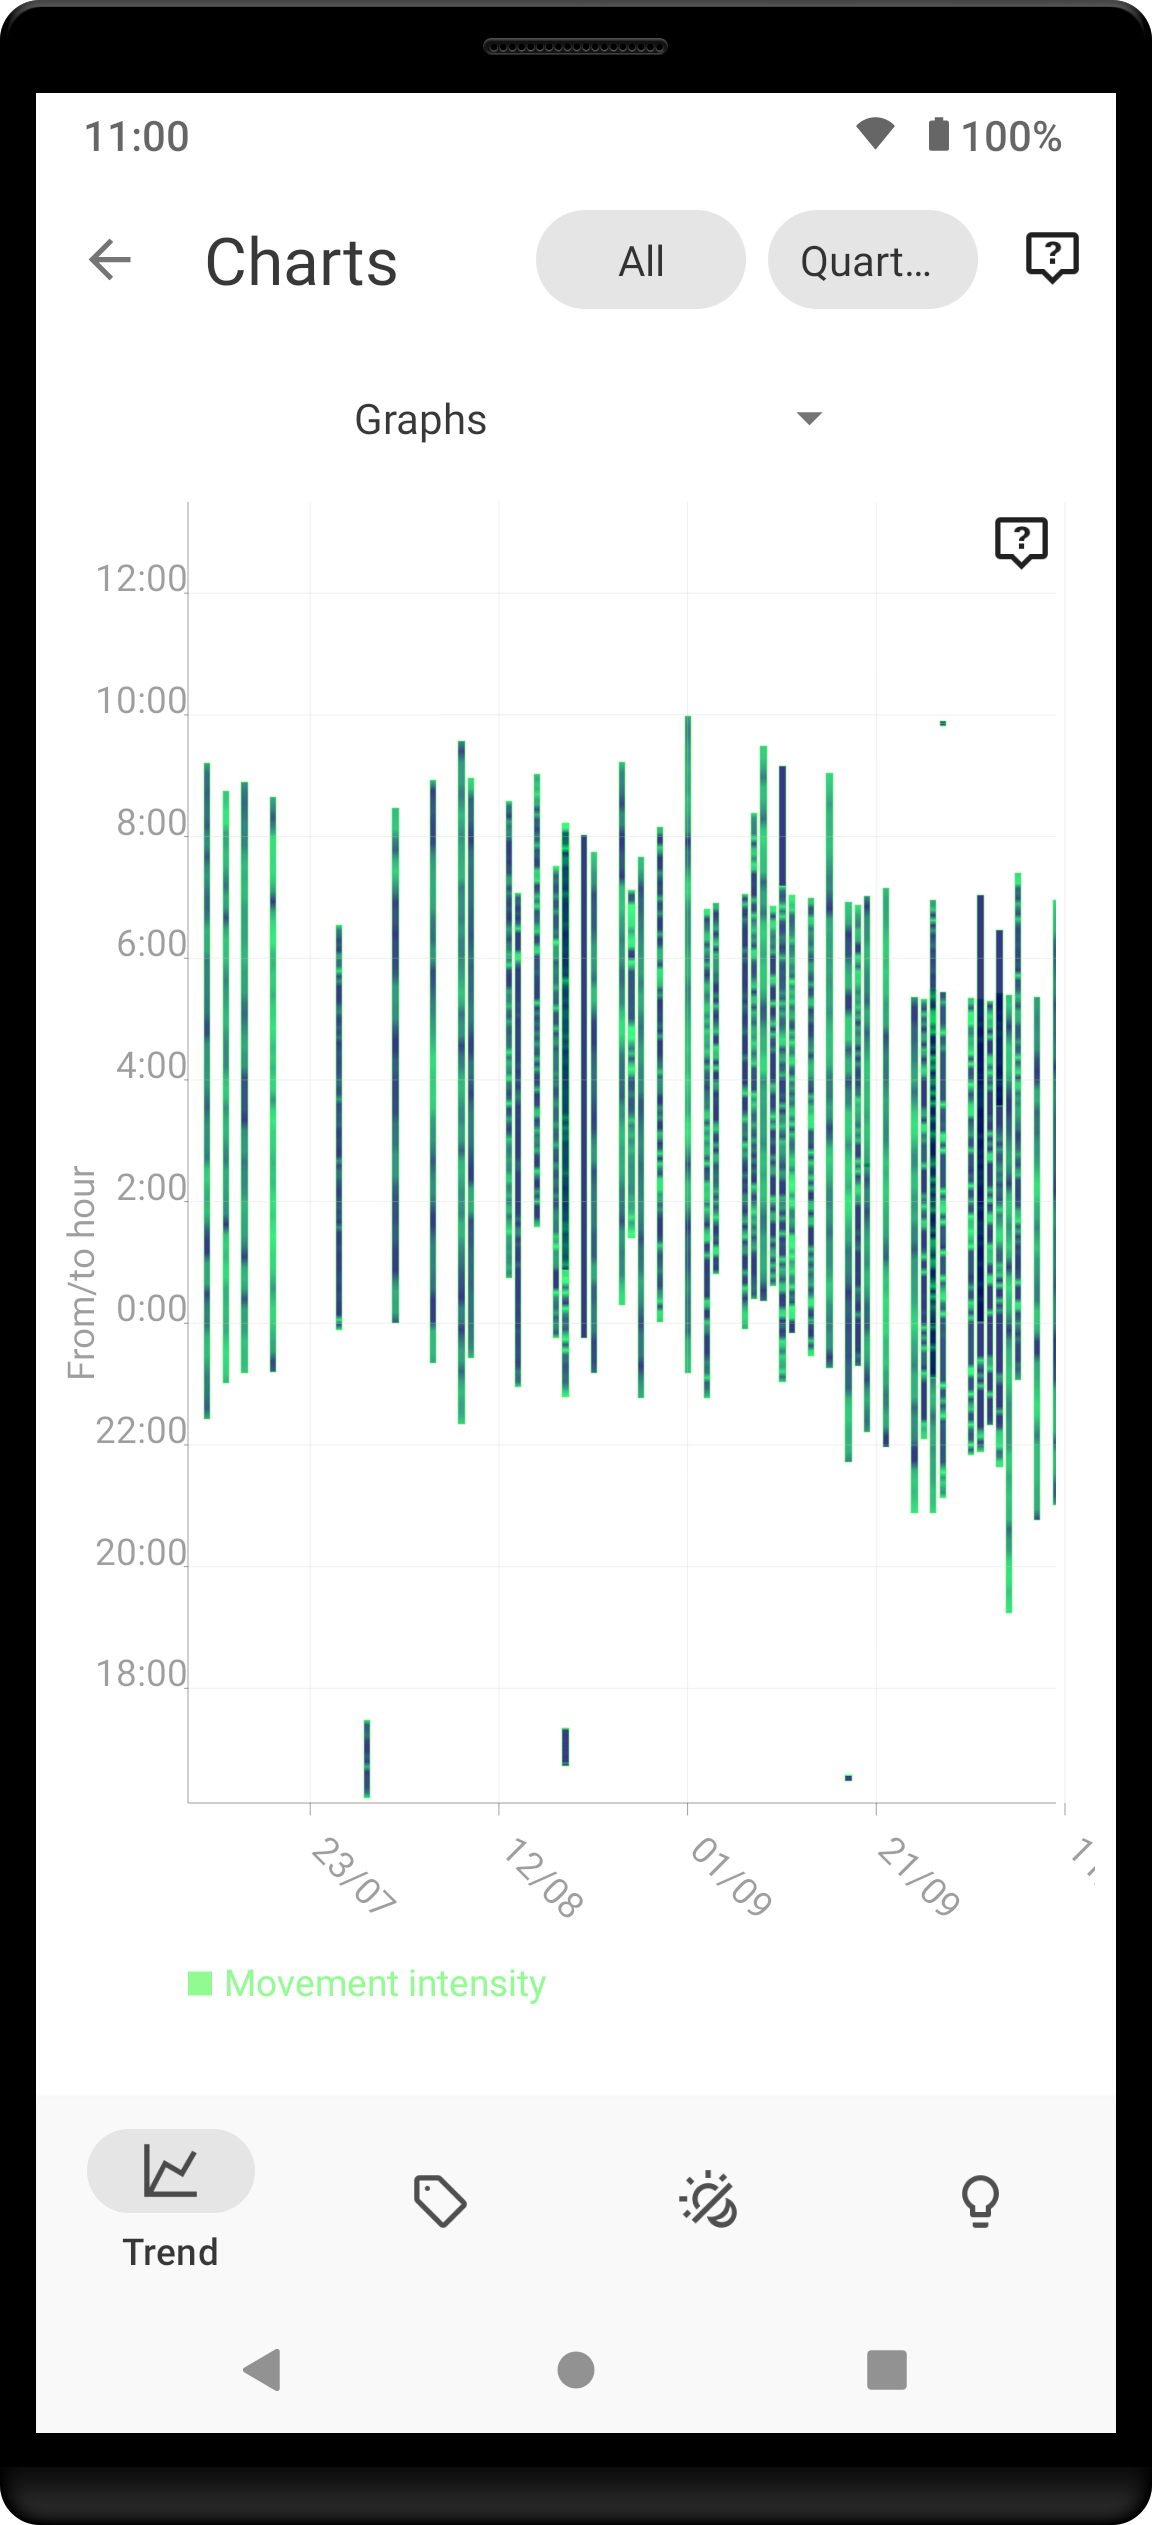
Also known as “sleep bars,” these show movement intensity throughout the night.
- The chart spans from 12:00 PM to 12:00 PM the next day.
- Green Peaks: Indicate more intense movement.
- Regular cycles that shorten toward the end of the night indicate healthy sleep.
Fall Asleep Hour#

Tracks when your sleep tracking sessions typically begin. Look for a flat line with minimal spikes to ensure consistency.
Smart Wake-Up#

Shows how many minutes before your set alarm the app woke you up. If this is consistently at 0 or at your maximum period, you may need to adjust your sensitivity.
Snooze#

Tracks how many minutes you spend snoozing each morning. To help lower this value, try setting Snooze Limits.
HRV (Heart Rate Variability)#

Tracks total heart rate variability (SDANN) throughout the night. Higher values are generally better, though targets are highly individual based on age and fitness. Learn more about HRV here.
HRV Gain#

Measures the difference in HRV between your first and last low-activity periods of the night. It should ideally stay in the purple (positive) spectrum.
HRV Before Wake-Up#

Tracks your HRV specifically in the period before you wake up. Higher numbers indicate better recovery.
Respiratory Disturbances#

The sum of detected respiratory disturbances (RDI). Values above 10 indicate potential issues. Ideally, this line should remain close to 0. Learn more here.
Tags#
This section compares the characteristics of sleeps based on the tags you use (e.g., comparing snoring on #alcohol nights vs. #sport nights).
This section only analyzes records that have at least one tag.
Duration#

Average durations (in hours) for sleeps with a specific tag.
Deep Sleep %#

Average deep sleep quality for tagged records.
Rating#

Average subjective user rating for tagged records.
Awake#

Average awake duration for tagged records.
Chronotype#
Chronotype represents your natural sleep pattern on the spectrum between 100% Night Owl and 100% Morning Lark. Learn more here.
Chronotype statistics require at least one month of tracked data.
Mid-Sleep Hour#

Shows your all-time average mid-sleep hour compared to the global average. Your position is highlighted-points further right indicate a Night Owl tendency.
Chronotype Trend#

Tracks how your chronotype evolves over time.
Social Jetlag Clusters#

Maps individual sleep sessions to identify Social Jetlag.
- Horizontal axis: Wake-up time (Left = earlier, Right = later).
- Vertical axis: Duration (Top = longer, Bottom = shorter).
- Clusters: Working days vs. Free days. Ideally, these clusters should be close together.
Social Jetlag#

Compares your mid-sleep hour on free days vs. workdays. Smaller differences indicate lower social jetlag.
Advice#
Fall Asleep Hour Regression Model#

Predicts how changing your bedtime affects sleep quality.
- Blue Curve: Predicted Deep Sleep %.
- Orange Curve: Predicted Rating.
- Maximize: Focus on the maximum point of the curves to find your ideal bedtime.
Duration Regression Model#

Predicts how changing your total sleep duration affects your quality and rating. Use this to find your personal “sweet spot” for sleep length.