Sleep apnea#
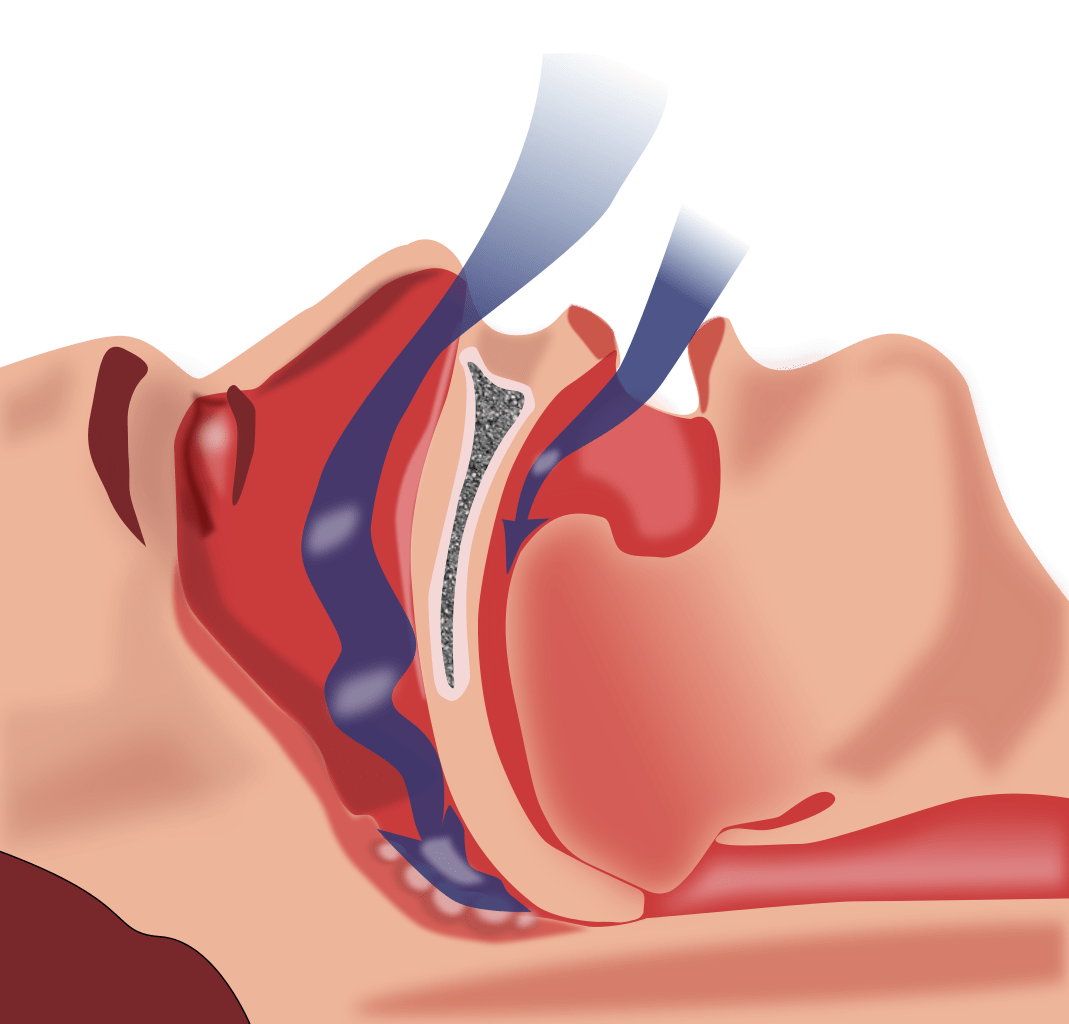
Sleep Apnea (specifically Obstructive Sleep Apnea, or OSA) is a common sleep disorder where breathing repeatedly stops and starts throughout the night. These pauses reduce blood oxygen levels, fragment your sleep, and place extra stress on your heart.
Sleep as Android helps you keep an eye on your respiratory health overnight. Using non-contact acoustic sensors, phone microphones, or connected wearables, the app monitors your breath rate, detects temporary pauses in breathing, and flags potential risk indicators on your sleep charts.
⚠️ Important Medical Disclaimer: Sleep as Android is a sleep tracking app, not a medical device. It does not diagnose sleep apnea. However, it serves as an early screening tool to help you identify symptoms and gather data to share with your physician or sleep specialist.
Why Home Pre-Screening Matters#
The clinical standard for diagnosis is polysomnography (PSG), which involves spending a night in a sleep lab. PSG is comprehensive but can be expensive and intimidating.
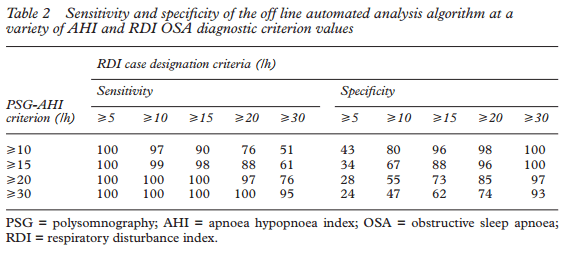
Home pre-screening using Pulse Oximetry provides a convenient, cost-effective alternative. While not a medical diagnosis, it calculates your Respiratory Disturbance Index (RDI), which correlates strongly with the clinical AHI (Apnea-Hypopnea Index) used in labs.
RDI compared to clinical Sleep Lab data
How Sleep as Android Monitors Breathing#
The app uses advanced signal processing to analyze your respiratory rhythm while you sleep:
- Oximeters: Get a Pulse Oximeter compatible with Sleep as Android and suitable for whole night oxygenation monitoring.
- Sonar Tracking (Contactless): Emits silent ultrasonic soundwaves from your phone’s speaker to bounce off your chest, measuring micro-movements to calculate your Breaths Per Minute (RPM). This value is calculated automatically from the data, you don’t need to enable it specifically.
- Wearables: Pairs with smartwatches and their SpO2 sensors to record continuous heart rate and blood oxygen saturation levels. Follow the guide for wearable tracking.
- Audio & Snoring Analytics: Uses your phone’s microphone to detect snoring, choking sounds, or sudden gasping after pauses. Read more details about Sound recognition in this chapter.
Identifying Apnea Indicators in Your Charts#
When reviewing your overnight sleep graphs, look for the following patterns:
- Breathing Rate Spikes & Dips: Healthy adult resting breath rate is typically 12-20 breaths per minute. Sharp drops followed by a spike may indicate temporary breath pauses.
- Oxygen Desaturation (SpO2 Drops): Drops in blood oxygen levels below 90% often accompany apnea events.
- Micro-Arousals & Motion: Sudden spikes in motion or micro-awakes immediately following a quiet period often mean your body briefly jolted awake to resume breathing.
Suspect You Might Have Sleep Apnea?#
If your graphs show frequent breathing disruptions or if you wake up feeling chronically exhausted, dry-mouthed, or sore-throated, you should consult a healthcare provider.
Official Medical Screening Tool (STOP-BANG)#
Before seeing a doctor, you can take a scientifically validated, free screening questionnaire used by sleep clinics worldwide:
- 📋 Harvard Division of Sleep Medicine - Sleep Apnea Self-Evaluation
- 📋 American Academy of Sleep Medicine - STOP-BANG Questionnaire Guide
This 8-question self-test evaluates common risk factors (Snoring, Daytime Tiredness, Observed Breathing Pauses, High Blood Pressure, BMI, Age, Neck Size, and Gender). Sharing your score alongside your Sleep as Android charts can help your doctor decide if an official sleep study (Polysomnography) is needed.
❓ FAQs & Troubleshooting#
Can Sleep as Android officially diagnose me with Sleep Apnea?
No. A formal medical diagnosis requires a clinical overnight sleep study (polysomnography). Sleep as Android acts as an early warning/screening tool to alert you to potential patterns.
What should I show my doctor?
You can share your sleep history with your doctor via:
- Online Read-Only Link (Recommended): Generate a secure, read-only link via your SleepCloud account. This lets your doctor inspect your graphs, breath rate trends, and audio recordings.
- Screenshots: Export your sleep charts showing your Breath Rate (RPM), Snoring logs, and SpO2 graphs.
Why is my breathing rate graph missing or showing flat lines?
- Reason: Sensor orientation or connectivity issues.
- 👉 Fix:
- If using Sonar, ensure your phone’s speaker/microphone is oriented toward your chest and no headphones are connected.
- If using a wearable, ensure the band is snug so the optical sensors can read pulse and respiration data reliably.
- For more details, see the sonar troubleshooting and wearable brand sections.
Need further help? Contact us via Left ☰ Menu → Support → Report a bug.