Tags
Tags allow you to find out how various lifestyle events affect your sleep.
Tags can be added:
-
while sleep tracking, by tapping the
 button
 -
in the rating screen, after you finish sleep tracking
-
in any sleep record, by tapping the big
button
You can add tags to any sleep record by including it in the comment section of the record. Any word can become a tag if you prefix it with #. Emoji also count as tags. See also editing tags.
There are also predefined icon tags, and a handful of automatically added tags.
The tags are arranged in the order based on the frequency of use.
1. Icon tags
You can choose from the list of pre-defined tags with icons, which include the most common lifestyle events which have some relevance to sleep.
| Icon tags |
|---|
|
2. Automatically added tags
Some tags are calculated and added to your sleep record automatically. You can turn this feature off in Settings → Personalize → Morning screen → Automatic sleep tagging.
| Automatically added tags |
|---|
|
2.1. Location tags
We calculate the 4 most frequent places in the past year of your data history. One year should be sufficient so that you can e.g. watch your sleep at your holiday home where you go regularly in the summer.
Should you move, your new home will gradually become #geo3 → #geo2 → #geo1 → #home after some time as it becomes dominant in your data.
You can also reset your home location any time using Settings → Privacy → Reset home location.
|
|
Location permission needs to be granted. |
The location we use is coarse and we store it even coarser, +/- 5 km. In effect, we identify your location as a square and then match those squares to set up the location tags.
You can completely turn off location storing in Settings → Privacy → Don’t store sleep location.
2.3. Sensor
If you use a wearable or sonar, a #watch or #sonar tag will appear on your graph.
2.4. Automatic sleep tracking
If sleep tracking was started automatically for your (you did not hit the ![]() Sleep tracking button) an #auto tag will be added.
Sleep tracking button) an #auto tag will be added.
You can see more on this feature here.
2.5. Pair tracking
If pair tracking was used #pair tag will be added.
3. Custom tags
You can create your own personal tag, the only requirement is using the hash mark notation at the start, followed by any number of alphanumeric character (For example #headache or #travel).
4. Frequency tracking
It is also possible to track frequency of your events. For example #caffeine_3x – meaning 3 coffees, #alcohol_2x – 2 shots, #sport_3x – 3 hours of sport. This allows to describe your lifestyle events more precisely.
|
|
Support for automated analysis of the frequency information is not yet included in the app, but it is planned in coming versions. |
You can add frequencies easily but pressing the tag button multiple times. To delete a tag on the other hand — long press the tag icon.
5. Editing tags
Your personal tags can be edited, if needed. The tags will be changed on all graphs and also for the statistics.
|
|
You can edit only text tags, emoji tags cannot be altered at this moment. |
5.1. Renaming tags
-
Open the list of graphs from the Left ☰ menu → Graphs.
-
Long press on the graph and select Rename tag.
-
To the first field, type the old name of your tag.
-
To the second field, type the new name of your tag.
-
Confirm with OK button.
-
Confirm the 'Are you sure?' dialogue.
5.2. Deleting tags
-
Open the list of graphs from the Left ☰ menu → Graphs.
-
Long press on the graph and select Rename tag.
-
To the first field, type the old name of your tag.
-
Keep the second field empty.
-
Confirm with OK button.
-
Confirm the 'Are you sure?' dialogue.
6. Analyzing tags
Tags divide your sleep history so you can compare nights with a given tag to nights without that tag. See Charts.
You can evaluate the influence of tags in Charts and in Statistics
In Stats, there is a collapsible Tags section which shows average sleep measures so that you can easily compare your overall average measures (sleep length, deep sleep, snoring…) with your tagged results. If you observe e.g. a significant drop in deep sleep % after drinking coffee, you may consider to reduce caffeine consumption (especially before sleep) in order to improve your deep sleep %.
FAQ
It is possible to revert up to 5 changes made while editing a graph.
-
You can use the Undo banner (appears each time you change a graph):
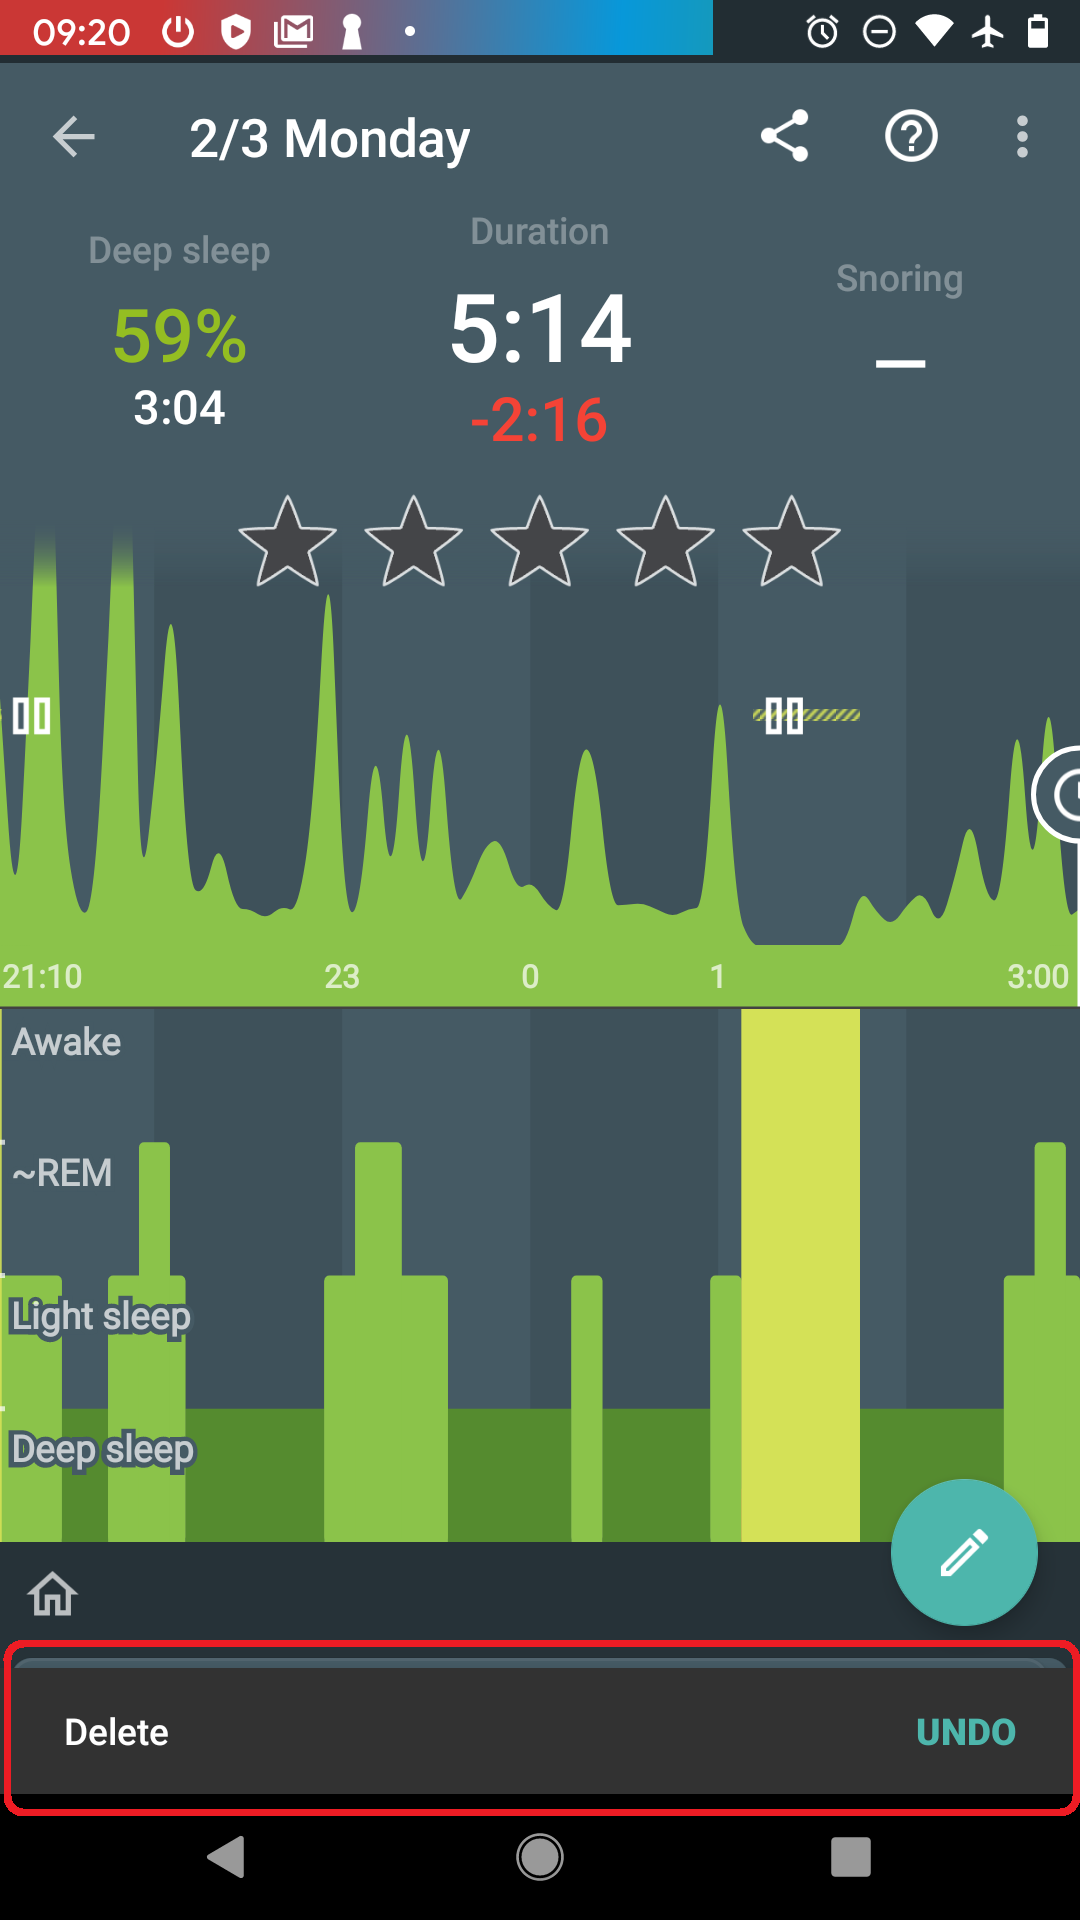
-
Or you can use ⋮ menu → Undo option
If you delete the graph from the Sleep app and it comes back later, check if the graph has ![]() icon. These graphs are synced from an external service - either Samsung Health, Health Connect, or Google Fit.
icon. These graphs are synced from an external service - either Samsung Health, Health Connect, or Google Fit.
If you delete the graphs there too, the they won’t reappear in the Sleep when you delete them.
Sleep duration is the sum of all your sleep stages (light, REM, and deep), not including waking stages - because you are not really sleeping when you are awake.
So on default settings, your Sleep Duration ,ay be a little shorter than your tracking time.
If you want your sleep duration to be the same as your tracking duration:
-
Disable the awake detection in Settings → Sleep tracking → Awake detection.
-
You can also try to adjust the sensitivity of each type of settings to get optimal results. In most cases, too many awake periods are caused by significant HR peaks.
-
If you are not sure, where these awake periods are coming from, please use the Left ☰ menu →
 Support →
 Report a bug, and send us the application log.
We use a different input than polysomnographists, and define our own sleep phases, reflecting an objective aspect of sleep, easy to measure with common devices. One naturally needs to ask whether there is any relationship between the EEG-phases and our ACT-phases.
Fortunately, several research teams raised similar questions before (See this one, or this one, or this one, or this one). They measured a bunch of people on a traditional polysomnograph and recorded their physical activity at the same time (By filming them and then counting the movements manually, or by using accelerometer readings). The published analyses show that there indeed is a significant statistical relationship between EEG-phases and body movements.
You can also read about comparison of Sleep as Android algorithms and Sleep lab results on our blog here.
Accelerometers are really sensitive, which is great for sleep tracking. Usually what you see when you leave the phone on the table is immediately dwarfed when you make a more significant movement. Just leave the phone on the table for a while and you will see a dramatic spike, but then move the phone and you will see that all the development is really tiny compared to the new peak.
So what you see is random noise caused by very small vibrations of the table or in very quiet areas by seismic movement. We mark the data relatively, so you can always distinguish between light and deep sleep. However, the algorithm works well only in conditions, it assumes i.e. in the bed with relatively large movement peaks.
To be more precise, if you leave the phone on a table, you may get values perhaps in the range of 0.000001 to 0.000009 m/s2 (the value is made up here, but it is physically very small). In the bed, you can get values from 1 to 9 m/s2 (which is physically large). However, the algorithm only sees that the high value is 9 times higher than the low value in both cases.
We had to do this because each accelerometer (in different phones) measures differently, so we couldn’t assume a standard conversion formula that responds to absolute values.
So if you use the phone in bed, it is indeed drastically different from measuring in a quiet place, like the table.
Please do not hesitate to contact support@urbandroid.org for clarification. You can also read more about how our data compares to sleep lab results at in this post.
There are several reasons why your graphs may be flat.
If you can see some movement on the actigraphy, but the graph is unusually flat:
. Sonar - make sure the signal is strong enough by keeping the sonar volume at max at Settings → Sleep tracking → Test sensor → blue sliding bar.
- You can also try a different frequency by selecting other frequency from the drop-down menu list in Settings → Sleep tracking → Test sensor → Frequency
- Keep the phone closer to your bed.
- Try different positions of the phone.
. Accelerometer - try keeping the phone closer to you.
-
Disable all system restrictions applied to Sleep as Android, or any companion app for tracking with a wearable: https://dontkillmyapp.com/
-
If there are too many awakenings falsely estimated on your graph, use the Left ☰ menu →
Support → Report a bug, and send us the application log. -
Most often the awakes are driven by significant HR peaks (awakes align with HR red line graph), you can try to disable this type of awake detection in Settings → Sleep tracking → Awake detection → Heart rate monitoring.
-
Another common cause is phone screen turned on, you can try disabling the Awake when using phone awake detection in Settings → Sleep tracking → Awake detection → Awake when using phone.
If the tracking stops completely after few minutes, the background processes are restricted by your system.
-
Make sure no system restrictions are applied to Sleep as Android, or any companion app for a tracking with wearable: Check our guide here.
-
If the guide won’t help, send us your log using Left ☰ menu →
Support → Report a bug.
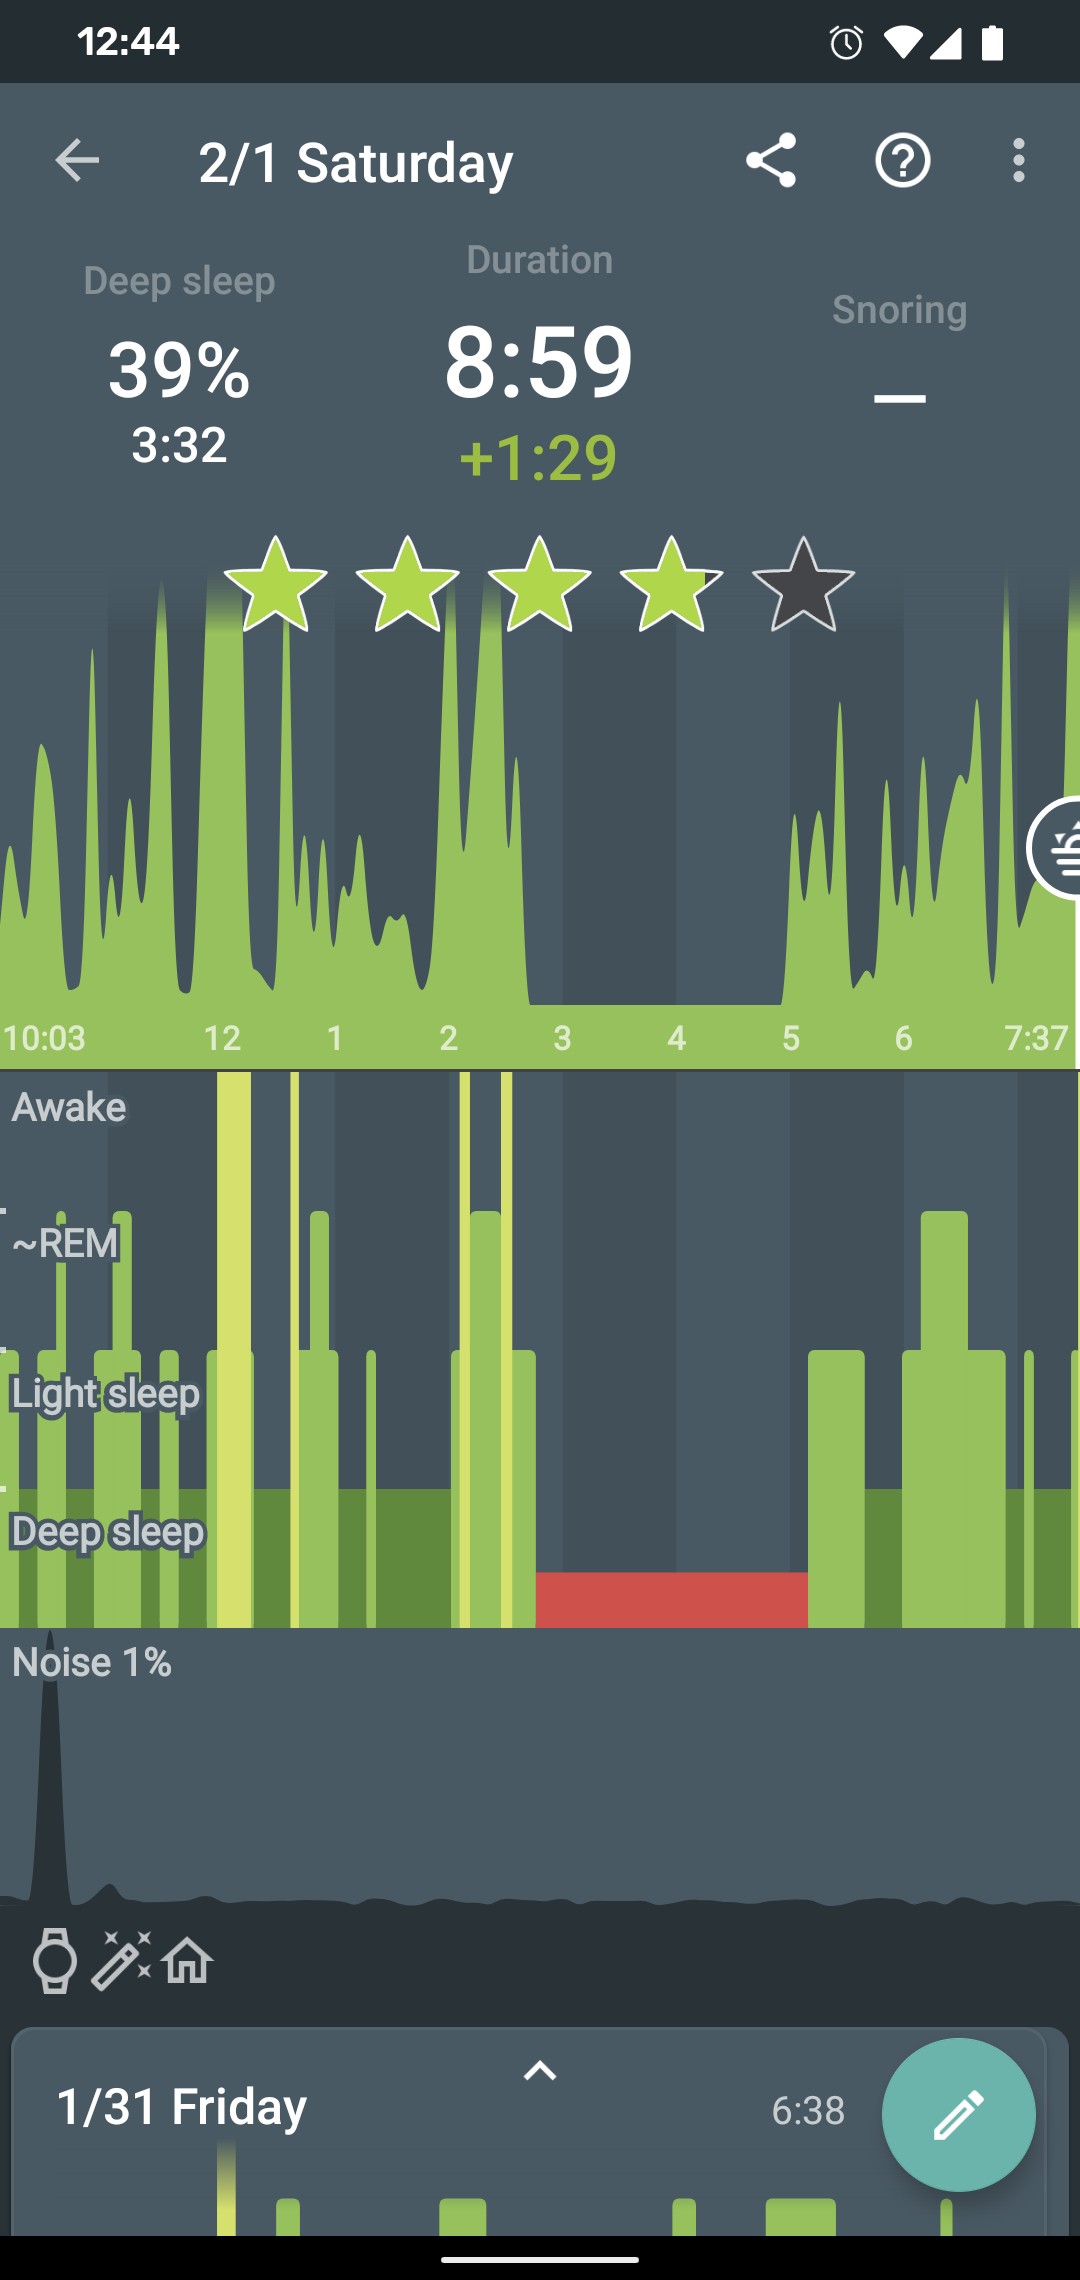
The red block indicates that something went wrong with tracking at that time and the device stopped providing sensor data for some reason. Usually those are some non-standard battery optimizations or battery savers, the battery gets too low so we preserve it for the alarm or connectivity issue if you use a wearable.
1. Battery restrictions
Make sure no system restrictions are applied to Sleep, or any involved apps like wearable companion app).
See our guide here, and follow the instructions.
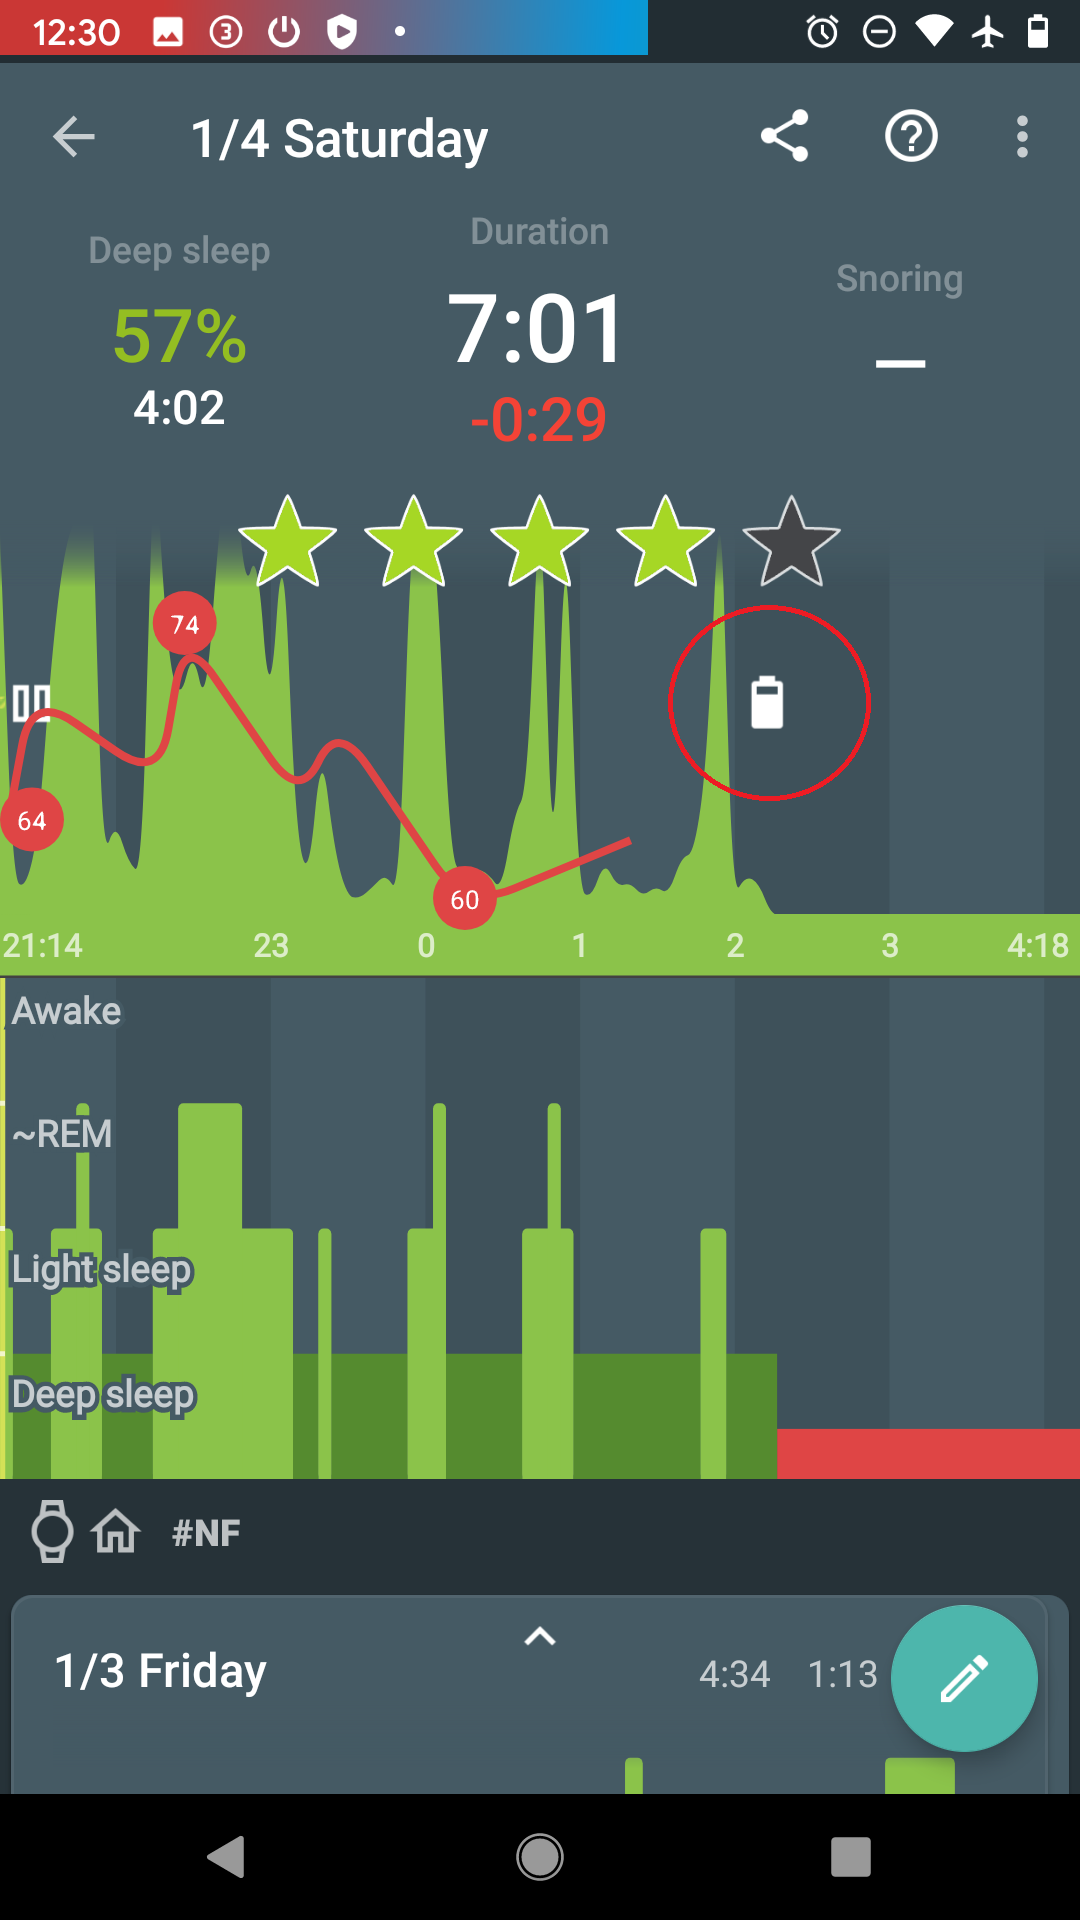
2. Too low battery
When the battery is too low (usually below 10%), data collecting is terminated to preserve enough battery for alarm.
When the battery was too low, there is a battery icon is displayed on the graph:
3. Connectivity issues with a wearable
When the connection with the wearable is lost, you can see red sections on the graph. The app always tries to reach the wearable again.
The graph can look like this:
-
Opt-out from any battery restrictions is applied by your system (https://dontkillmyapp.com/)
-
Pair the wearable with your phone in System settings.
-
Make sure the BT is not lost, and try lowering the distance between the phone and the wearable.
-
Try settings the device as Trusted device.