
- SleepCloud study
- How do the data look?
- Snoring: an apology for the pathology
- A case for the smart alarm
- How do we sleep post-brexit?
- Want to stop snoring? Have a beer!
- On Social Jetlag
- World never sleeps
- The World is Sleep Deprived
- How does Sleep as Android compare to the Sleep lab
How we measure your dreams
The science, craft, art, and magic of sleep phases detection
- Did COVID-19 pandemic improve our sleep?
Executive summary
For years we have been skeptical about REM estimates from actigraphy (the mother for sleep tracking which can be used at home). At first glance this tasks seems like an attempt to measure your IQ through your running speed. But after analyzing a large PSG (Polysomnography) data-set we have found out there are indeed quite interesting regularities in sleep phases which give us a good change (around 40% with minimum false REM) to find a REM stage onset. This gives us the opportunity to introduce a brand new REM estimate algorithm into Sleep as Android. Read on to find out how we did it.
Attentive users of Sleep as Android certainly noticed that their hypnogram with REM phases looks very different in the new release.
Indeed, we have revisited our sleep phase detection algorithms and implemented some substantial improvements, based on large medical data analysis. It has always been a topic of vivid interest among our users – what do the sleep phases mean, how to interpret them, how accurate they are or can be. Let’s discuss the issue and the underlying principles more in details and cast some light on this esoteric area.
Sleep phases
Nothing had been known about the structure of sleep until about half of the last century. Well, sleep looks … just like sleep to a regular observer.
Then the early experiments with brain activity measurement (using EEG – recording tiny fluctuations of electric potential on the scalp) revealed the existence of several distinct kinds of sleep alternating throughout the night. Further research showed that the phases characterized by specific EEG pattern correspond to other sleep qualities, such as the likelihood of dreams, or how easy is it to awake.
Four major phases are usually recognized today.
- N1 (abbreviation for non-REM-1) – a short transitional stage between sleep and wakefulness.
- N2 – mostly light dreamless sleep occupying about 60% of the night.
- N3 – the deepest sleep phase. The body is totally relaxed, EEG displays slow regular waves. This stage is believed to play a crucial role in the regenerative processes. Dreaming (so called non-REM dreaming) can occur but is not that common as in REM.
- REM – high likelihood of vivid dreams, muscle paralysis, bursts of rapid eye movements.
The phases alternate in a typical sequence called sleep cycle – from a short N1, via N2, to the deep N3, then a shorter transitory N2, followed by REM, interrupted by brief awake. The cycle repeats several times throughout the night. The picture below shows a typical hypnogram, capturing sleep phases during one ordinary night. However, the pattern is highly variable. The lengths and exact ordering of the phases differ in each individual case.

A lot has been found about various external and subjective manifestations of the individual sleep phases. Little is known, however, about the actual mechanics how they contribute to the recovery and cleansing processes – what is happening “under the hood”. The only thing we can say for sure is that enough sleep, including the full sleep cycle, is essential for all aspects of physical and mental health.
Polysomnography
Today’s golden standard for clinical sleep monitoring is called polysomnography (PSG). The patient spends one or more nights in a laboratory, trying to sleep as normally as possible, with dozens of electrodes attached to his body. They monitor his brain activity (EEG), eye movements (EOG), muscle tension (EMG), and several more quantities.

Typically, a human specialist watches the sensors and evaluates the records manually. Part of his task is an assessment of sleep phases (N1, N2, N3, REM) by spotting typical activity patterns on the sensors, mainly EEG.
While providing a detailed record of many variables, polysomnography is a laborious and expensive procedure. Current sleep research is often limited to a small data set due to the measurement costs. It is unrealistic to use polysomnography for large, population-wide studies, or many nights per patient. Furthermore, sleep on a polysomnograph is hardly fully natural. Even though the lab operators try to make things as comfortable as possible for the test subject, he still has dozens of electrodes attached to his body, cannot move freely in the bed, the room is unfamiliar. Nobody knows how much these factors affect the results and what the true outcomes would be in a natural situation.
There has been a lot of research on how to monitor sleep with cheaper devices that anyone can have at home and operate on his own. The question is especially relevant today when everyone owns a little box loaded with all kinds of sophisticated sensors – a smartphone.
Activity-based sleep phases
Let me emphasize one more time that the aforementioned sleep phases are defined mostly by EEG patterns, and can be accurately identified only from EEG readings. Let’s call them EEG-phases in the following text, in order to avoid confusion.
There is, obviously, no EEG in a smartphone or common wearables. However, we can monitor a sleeper with sensors that are available in these devices, and it makes perfect sense to analyze the measurements and see if they display any patterns. In Sleep as Android, we focus mostly on detailed monitoring of body movement throughout the night, using a wide range of available sensors (integrated accelerometer, sonar, infrared sensor).
And indeed, there are typically distinct phases of very low physical activity, when the body is completely relaxed, and periods of high activity, when the person is tossing and turning on the bed, rolling, twitching, and jerking. See a typical example showing the amount of activity during one night.

Thereby we can define two sleep phases – light sleep and deep sleep. These phases are shown in hypnograms in Sleep as Android and are used by the app for triggering smart alarms. Let’s call them ACT-phases, as they are based purely on the average short-term amount of physical activity. It’s an objective phenomenon, just like the EEG-phases. We can imagine them as a picture of the same underlying process (sleep) from a different angle. Either picture (EEG-phases, ACT-phases) captures a valid aspect of the reality.
How do the two kinds of phases relate?
We used a different input than polysomnographists, and defined our own sleep phases, reflecting an objective aspect of sleep, and easy to measure with common devices. One naturally needs to ask whether there is any relationship between the EEG-phases and our ACT-phases.
Fortunately, several research teams raised similar questions before (See this one, or this, or this, or this). They measured a bunch of people on a traditional polysomnograph and recorded their physical activity at the same time. (By filming them and then counting the movements manually, or by using accelerometer readings). The published analyses show that there indeed is a significant statistical relationship between EEG-phases and body movements.
Unsurprisingly, N3 phase displays the least amount of physical activity. Contrarily, N1 and REM are phases when the body is moving the most. The activity in REM might look surprising at first glance. It is known that large muscles are paralyzed during REM, as vivid dreams typically occur at this stage, and the body must be prevented from acting them out, jumping over the bed, riding a spaceship, fighting space villains. The paralysis is not perfect though, and limbs or trunk often randomly jerk and twitch.
The phase N2, in which the sleeper spends about half of the night, is somewhere in between. Sometimes the physical activity is low, especially when N2 precedes a deep sleep phase, sometimes the activity is higher, before or after N1 or REM phases.
Generally, the deep phases detected by our app roughly correspond to N3 and partly N2 EEG-phases, and light sleep corresponds to REM, N1, and partly N2.
However, the amount of movements varies greatly, based on age, gender, individual specifics, health, mental state, etc. There is no exact correspondence between such and such movement frequency and a specific sleep phase. The only overall reliable principle is that relatively low activity intervals are mostly N3 or N2, and relatively high activity intervals are likely to be REM, N1, or N2. Any attempt to pinpoint the exact beginning of a sleep phase is subject to a high degree of error and guesswork.
Nonetheless, this is still a useful approach, providing valuable insights with home-made sleep recordings. Large data can be collected cheaply for population-wise studies. Individual sleep enthusiasts may discover their own sleep patterns and possibly devise their own personalized sleep phenomenology.
How about the REM phase, finally?
REM phases are of special interest to our users. Some sleep enthusiasts experiment with lucid dreaming – using our gentle alert triggered during a possible REM phase to become partly conscious and self-aware and get actively engaged in the dream. Others are just curious to see their REM phases on the chart.
Now, wait a minute, in the light of the previous paragraphs, how dare we draw REM phases into our hypnograms? They are based on pure guesswork, right? Well, yes and no. Again, building on contemporary research and our own data analysis, we can produce meaningful results even from activity data alone.
We already know that REMs occur during the periods of higher physical activity. But it is still about 65% of the sleep time for an average user. Can we pinpoint it better?
The idealized sleep cycle, as depicted in textbooks, lasts about 90 minutes, and REM occurs soon after the N3 phase (mostly corresponding to our deep sleep ACT-phase). How reliable this pattern is, however, in reality, and how much of it is just a textbook cartoon?
Luckily, there is a publicly available database of tens of thousands of anonymized records from sleep labs. A large portion of them was annotated by human operators and individual sleep phases were marked on them. We acquired the data and ran some quantitative analyses on them to get a better insight into typical sequences and duration of sleep phases. The data confirm the idealized story to a great extent. Indeed, the pattern [N3 – short N2 – REM] is very common in the live data.
For example, 10 minutes after the end of N3 phase, there is 40% chance that the sleeper is in REM. 40% – it’s less than half – right? But the total amount of REM sleep is about 15% in this dataset, so this simple criterion alone increases the probability of correct REM detection nearly three times, compared to a random benchmark.
We ended up with a simple criterion: when there is a long enough deep sleep period, followed by a long enough light sleep period, we mark the first half of the light sleep (after a short initial offset) as REM. There is no way to tell if there actually was REM at any particular moment, based solely on aggregate activity data. But the approach is statistically valid. In average, the overlap of the actual REMs with the REMs marked on our charts is much better than just random, and we are really getting close to the limits of what can be inferred from smartphone inputs.
A natural question arises now – how do the new REMs, marked within the light sleep intervals, relate to the former REMs, marked at the end of deep sleep?
Our former approach to show REM phase estimates in our hypnogram was based simply on the known REM duration averages per sleep stages. To put it simple for every sleep phase (deep sleep + light sleep pair) which satisfies a duration threshold a percentage of the phase was marked as REM.

The thresholds were set quite high which led to less REM depicted than in the new approach which is more in line with the relative REM amount seen in the large PSG data set.
As not much was known about the actual position of the REM stage we did depict it at the transition of the deep sleep stage into light sleep.
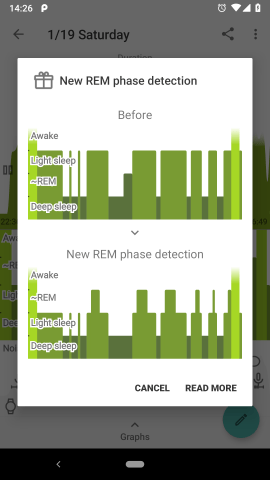
Although the actual length of the estimated REM phase is still blurred and it seems unrelated to other parameters of the sleep phase, in the new approach we know more about the most probable position of REM. This is why we now depict the REM phase few minutes after the light sleep start.
Formerly REM was depicted between deep and light sleep. This has now changed and we are showing REM with higher bars between light sleep and awake which is consistent with how are PSG hypnograms plotted.
Coming next
This is not the end, we always strive to make our app better, and we already have some ideas how to improve REM detection, even with common smartphone sensors.
Some studies show that the nature of movements in REM and non-REM phases tends to be different. The moves in non-REM are more voluntary and purposeful, typically slower – like rolling on the bed or scratching. On the contrary, movements during REM, when muscles are mostly paralyzed, tend to be more like quick random jerks and twitches. We need to do some more data analysis to see if we can detect these patterns in activity record from mobile phone sensors. We hope that it will allow us to mark REM phases with better accuracy.
Another direction, so far in an early prototyping stage, is adding infrared sensors to our sleep mask. Then we might be able to monitor eye movements directly and hence recognize the REM phase quite accurately.
In the meantime, sleep long and prosper, now with a better understanding of your sleep phases and the meaning of our hypnograms.
33 thoughts on “
How we measure your dreams
The science, craft, art, and magic of sleep phases detection
”Gracias y mil gracias. Sleep me salvó la vida porque llegaba tarde al trabajo.
Si se fijan hace años que lo uso y lo compre. También compré el Mindroid… Pero tuve un problema con la máscara.
Gasté mucho dinero en la máscara. Esperé muchos meses a que llegara por correo.
Y no puedo usarla. El cable es corto. Si me muevo en la cama la desenchufe. Es incomoda. Una desilusión.
Mí otra opción era la lámpara.
Ahora me arrepiento por no comprar la lámpara.
Cuando tenga dinero la compraré. Espero resulte mejor.
Gracias a todo el equipo de trabajo.
Ustedes son genios.
Fabiana
Dear Fabiana,
thank you for your question. I understand the disappointment. There is quite an easy fix for both the short cable and unplugging – an USB extension cable like this (https://www.amazon.com/AmazonBasics-Extension-Cable-Male-Female/dp/B00NH11R3I) will help with the short cable, and to prevent unplugging, I suggest a DIY fix: just wrap it around once or twice with a duct tape. Since this isn’t a connection that would need to be unplugged often, it wouldn’t cause any trouble.
Jiri
Can you comment on how wearable data from say a watch with HR data can enhance your analysis?
What about heart rate monitoring and O2 sensors
Hello Robert,
It’s a good question, and there has been quite some research on this topic too. Just try to google something like “heartrate sleep phase detection” and it spits out dozens of relevant resources.
Some papers also present combined classifiers based on actigraphy and heart rate (not only heart rate as such, but also heartrate variability, and other derived measures). My overall understanding was that heart rates also carry some information, but much less than actigraphy. Most of the performance of the combined classifiers was derived from actigraphy alone.
We have done some experiments on our date and came to a similar conclusion. Furthermore, heartrate data from smart watches are typically heavily aggregated (in order to optimize batrery used), and are generally of rather poor quality.
So yes, good quality heartrate data might improve the classification a bit, but we decided to abandonn this direction for now due to practical reasons.
Best Regards
Jan
Hello Ted, please see my answer to the previous question. Jan
I certainly understand. To continue this line if thought, are you using the accelerometer data from the watch as a better measure of movement?
Hi, Could you also add auto dismissing/snoozing alarms, and the ability to delay when the lucid dreaming cues play after a custom amount of hours?
If the watch integrates with Sleep and tracking via smart watch is enabled, then we use activity data from the smart watch.
hello, I cannot find the new rem phase detection feature, is it on version 20190109?
Hello Hugh, it is being released gradually to an increasing random subset of users. It is available only to a random part of beta users at the moment. When the update hits your phone, you will see it in the new sleep records immediately, no explicit action is necessary on your part. It’s not available in 20190109.
Hey, great work guys. Always good to see that you keep improving the app. Are you going to retroactively apply this new analysis to previous data? Cheers!
Hello Marek, thank you for the India.
What I’m really interested is, is there any proven better methods to analyse sleep more accurately?
There are many options in the app, accelerometer, sonar, smart watch, sleep phaser….
Currently I own a Xiaomi Mi Band 3 and I tried to awiswi between miband and sonar and I think the measurements are quite differents.
I’m planning to try the sleep mask as well.
Hello Ditmar,
Thank you for your feedback.
We decided to leave the old records as they are and to display the new REMs only in new records.
It boils down to some internal implementation details – we store some more information in the new records, and it would not be so easy to do it without the information with the old record.
Jan
Hello Roland,
Thank you for your question.
I would say that the only generally accepted method for precise sleep detection is polysomnography.
There are dozens of different studies that attempt to estimate sleep phases from simpler sensors – actigraphy, heartrates, sound recordings, etc, but there is always a high level of error. One source of error is that the correspondence between these quantities and sleep phases is inherently imprecise. Another source of error is variable quality of sensors on common phones/wearables, or different non-standardized ways how people sometimes use/wear the devices.
It may also apply to your question about sonar vs miband.
Sonar works reliably only on some devices: https://sleep.urbandroid.org/documentation/faq/sonar-compatible-devices/
You can also try to run sensor test (Settings/Sleep tracking/Test sensor), put your phone to the same position that you use at nigh, move like you do at night, and check if it is showing the activity correctly.
Wearable are generally the most reliable source, however, generally, unfortunately, miband is the most problematic one to integrate – Xiaomi does not provide any API, so the integration is based on reverse-engineering, and anything may change/break any time.
Even if both Sonar and Miband work fine, the data never be completely the same – miband is measuring movement of your wrist, while Sonar monitors your entire body. But the correspondence is overall reasonably accurate, according to our experiments.
Best Regards,
Jan
Hello Hugh, can you please describe a bit more in detail how it should behave in your opinion? I am not sure I fully understand what you propose. Thanks, Jan
If I understand right you are using data about typical sleep patterns to better estimate sleep phases. It seems to me that an implication of this is that though the new algorithm may be more accurate for people in average, it will be less accurate for people with a sleep disorder that makes their sleep phases non-typical. If you aren’t getting enough REM sleep, for example, won’t this algorithm mask that?
Hi Eric, thanks for your question. It is as you say, to a large extent. REM phases can be accurately identified only from brain activity (EEG), eye movements (EOG), and other well calibrated sensors in a sleep lab. There is no such reliable device available for home use with mobile phones for sleep amateurs (yet). Therefore we based our classifier on characteristic patterns that are statistically valid for a large population, for people with typical sleep phases. We do not measure REM phases as such, but a proxy quantity (the amount of physical activity), which typically correlates with seep phases. Of course, there are countless sleep disorders, and we can say nothing about how the algorithm will behave in any such atypical case. Our app is not a substitute for a proper diagnosis by a certified specialist, and people should contact one if they suspect that there might be some serious trouble with their sleep.
Hi,
would you please tell me what would be the implications on the results having a second person on the same bed. Her movements will not affect the analysis ?
Hi Paulo, excellent question. Indeed, her movements may affect the measurement. It depends on your setup – how wide your bed is, how close to each other you sleep, how the sensors are located. Fortunately, we have a feature called pair tracking, which allows you to filter out the other person’s activity to a great extent. Please check this post for more details: https://sleep.urbandroid.org/pair-tracking/
Tks a lot for.the answer. Indeed, we’re more of the love birds type.From time to time the little bird also.finds its way to the nest in the middle of the night. In the other hand, movements from the partner will affect each other’s sleep pattern for real, not just the measurements Maybe the wereables is an answer to the measurements, but I’m still in doubt which on to choose. I have a Samsung phone, so maybe for compatibility issues, is better to stick with the same brand
Hello there,
I am trying to use the Rem detection for lucid dreaming purposes. Unfortunately, less then 50 percent of Rem events, as seen in the sleep graph, are actually triggering rem events. As I am using tasker to fine tune vibrations of my miband and add a delay for rem detection at the start of the night (first 4 hours of rem signals are ignored), I would also be fine with a second “raw” rem signal that is more sensitive than the standard one. Also I would appreciate it if you spend some love to the lucid dreaming feature as a whole. Two things that would enable me to reduce tasker usage is to be able to set a delay to allow for restorative sleep, bevor triggering starts and a delay between two signals, so there are not to many signals right after another. But I can do these things with tasker too, if rem signals are given correctly in the first place. Otherwise, great software! Thank you.
Hello Hank,
Thank you for your comment.
You are right, the sleep phases that you see in the graph after track is finished are different from the events that we emit during the night. The reason is that when have all the data from the entire night, we can normalize them better and (we believe) estimate the phases more precicely. In the realtime, we use a slightly different algorithm that works only with the last hour of data. The two outputs usually match pretty well, but it is possible that they differ a bit more in some cases.
Actually, there is a way how to tweak the REM signal sensitivity. It’s not documented, but you can try it out and see how it works for you. Please go to Settings/Sleep tracking/Smart wake up/Advanced. Then try to adjust “Movement intensity” and “Movement occurence”. These two parameters control not only smart alar, but also the rem detection. If you increase the sensitivity, you should get more REM signals. But if you will increase it too much, you might actually get less signals, because not enough deep sleep gets detected. As I said, it’s an unofficial feature, but you can play with it and it may work fine for you. You will be still getting 1 or 2 signals per one REM phase, but the realtime REM might match better the ex-post REM phases that you see in the graph.
Thank you for your suggestions, we are happy for all such feedback, and we are continually working on improvements of our app. Sooner or later, we will certainly revise the dreaming features too.
Best Regards
Jan
Hi Jan,
thank you for yout prompt reply and suggestion to adjust the sensitivity. I will try that 🙂
Best Regards
Hank
Congrats on this study! It is really nice to see that my data is being well used to improve the sleep analysis through daily devices.
I hope to read more about learnt lessons soon!
Your article refers to N1, N2, N3, REM, but the graph has another stage. Can you fix the article or responded here, so that it is easily understood.